Bitcoin long-term price performance from 2009 to 2021, with explanations of why significant price booms and bursts occur.

The best-known and most valuable cryptocurrency to date, Bitcoin, has experienced many milestones in recent years, but also turbulence. Due to these fluctuations, critics claim that it is clearly a price bubble. However, if you look at the overall performance of the last 10 years, you can see a long-term trend upwards. Below you will find a summary of the price and value development of Bitcoin from 2009 to March 2021.
Seed Phase: Bitcoin Performance 2009 – 2010
Bitcoin as a concept for a decentralized financial system was proposed by Satoshi Nakamoto (a pseudonym whose identity is unknown) in a white paper in October 2008 and first executed in January 2009. The project was still in an early stage and there were no usecases or sufficient market participants to set a price. It was not until a year later that a first value for the cryptocurrency was determined at $0.08/BTC, which corresponded to its production costs, i.e. the mining costs. The first discussions on the valuation of Bitcoin began in forums, as well as the first transactions for goods. In May 2010, the payment of two pizzas for 10,000 Bitcoin became very well known. What was equivalent to €18 at the time would have been worth more than $400 million today!
2010 also saw the establishment of the first crypto exchanges that allowed fiat currencies to be traded. On Mt. Gox, the most famous crypto exchange at the time, Bitcoin was traded for $0.06 / BTC, with a total market capitalization of $277,000. Exchanges had a positive impact on the crypto market as they standardized the organization and trading of digital currencies.
First Price Bubble: Bitcoin Performance in 2011
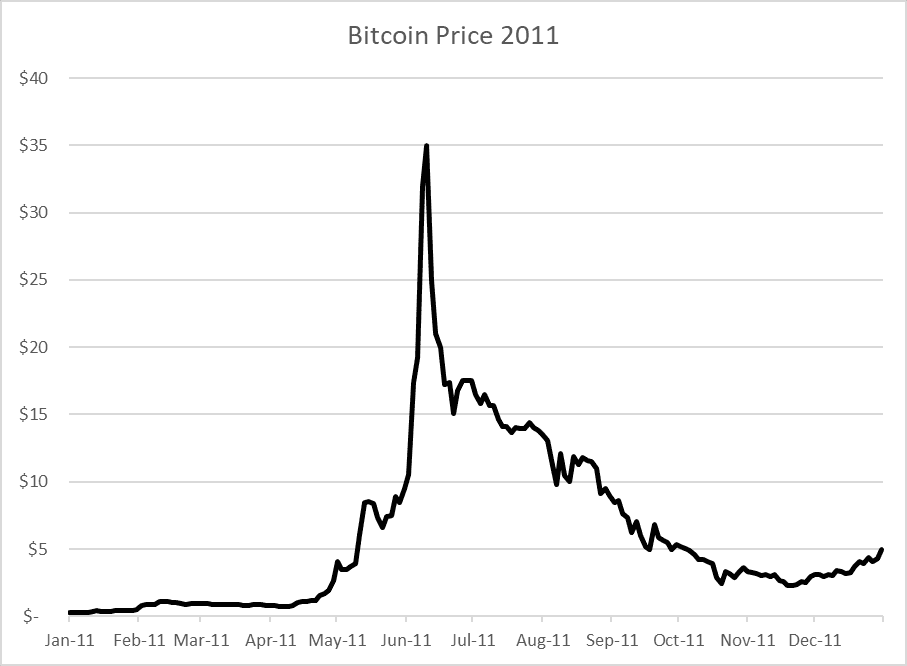
In January 2011, Silk Road, a marketplace for illegal goods on the darknet, was founded, allowing Bitcoin to be used as an anonymous payment method. This feature created an initial use case for the digital currency, which subsequently rose to over $1/BTC in February 2011. In the following months, several international crypto exchanges were established, offering various fiat currencies in exchange for Bitcoin. After various journalists also became aware of the cryptocurrency, media interest increased at the same time. Bitcoin’s price increased to $35/BTC by June 2011. This represents a growth rate of over 4,200% in 3 months and is considered the first Bitcoin bubble.
The trend did not last long as the media started to stigmatize Bitcoin as a currency for illegal trading and money laundering. The high price of the digital currency also attracted hackers who stole coins from the wallet of then inexperienced users. Crypto exchanges were also poorly regulated and victims of cyberattacks at the time. The negative sentiment led to a bear market with the price falling by 93% to a value of $2.29/BTC in November 2011.
Second Price Bubble: Bitcoin Performance 2012 – 2014

After the bubble burst, the price developed a comparatively moderate growth, increasing its value from $5/BTC to $14/BTC in 2012. The hype of the previous year was not regained as media interest flattened out.
In 2012, the first companies began to accept Bitcoin as a means of payment (including WordPress.org). This was followed by the next big boom in 2013 due to various factors.
There was a currency crisis in Southern Europe due to high government debt. The bank run in Cyprus in March 2013 made big headlines, causing people to lose confidence in the euro and look for alternatives. Many of these account holders invested in Bitcoin to escape the centralized banking system. From March to April 2013, the daily trading volume of the digital currency tripled and exceeded a purchase price of $100/BTC.
In the meantime, other cryptocurrencies such as Litecoin and Ripple were also issued. Media interest rose again and investors felt the opportunity to make money or the risk of missing this opportunity (FOMO). Due to the rising awareness, first states also started to introduce regulations for cryptocurrencies. The German Ministry of Finance recognized Bitcoin as a formal unit of account for private transactions. For tax purposes, cryptocurrencies are treated as private sales transactions, comparable to gold. The U.S. Treasury Department officially classified bitcoin as a „convertible virtual currency.“ These announcements led to positive sentiment towards cryptocurrencies and drove the price to an all-time high of $1,184/BTC on November 29, 2013.
Negative news followed in December 2013, after the Chinese central bank banned Bitcoin transactions for financial companies, as the virtual currency was allegedly only used for money laundering purposes. This was followed by more negative media in February 2014 after a hack attack on Mt. Gox, the largest crypto exchange at the time, resulted in the theft of Bitcoin equivalent to $400 million. From November 2013 to February 2014, the Bitcoin price fell by over 50% to a value of $553/BTC.
Third Price Bubble: Bitcoin Performance 2015 – 2018

By January 2015, bitcoin experienced a bear market with prices falling to as low as $199/BTC, followed by a period of stagnation between $215/BTC and $305/BTC by September 2015. The media hype subsided, but regulatory breakthroughs continued. In the U.S., the Commodity Futures Trading Commission classified bitcoin as a commodity. In the EU, cryptocurrencies were treated as currencies, with the note that they do not require VAT. Moreover, Bitcoin adoption grew, with more than 100,000 retailers accepting the cryptocurrency as a form of payment. Overall, Bitcoin made it back into a bull market in 2016 with a growth rate of 123%, reaching a price of $960/BTC.
In 2017, cryptocurrencies found their way into the mainstream and reached new heights of global media interest. In April 2017, bitcoin achieved a major milestone after being declared as a legal payment method by Japan. This included important regulations for crypto exchanges, which henceforth had to verify the identity of their customers to minimize money laundering and black market trading. The ensuing positive sentiment and media attention led to an increasing number of new investors who had never been involved with cryptocurrencies before. At the same time, ICOs triggered a hype comparable to the IPOs of internet startups in the 1990s. Many of these companies had not been able to generate profit or revenue before then, but still raised millions of dollars in capital from investors. Overall, the price increased by about 1,900% (from $1,000/BTC to $20,000/BTC) in one year.
The tipping point was reached in January 2018, when it became apparent, among other things, that many ICOs were funding junk companies. Institutional investors subsequently withdrew their support for cryptocurrencies. Negative press as the news that South Korea and China were planning to ban cryptocurrency trading (this has not happened to date) reinforced the price drop. Overall, sentiment tilted and led to a crash of about 60% (to $7,000/BTC) in Q1 2018.
Boom Phase: Bitcoin Performance 2019 – Q1 2021

In 2020, cryptocurrencies recovered from the previous bubble and reached new highs. By Q1 2021, Bitcoin reached a price of about 60,000 USD/BTC with a market capitalization of more than 1 trillion USD. Several reasons explain this development:
1. The 4-year halving in Bitcoin took place in May 2020, so the effort to mine the cryptocurrency has increased.
2. The Corona pandemic in 2020 had the side effect of making people more aware of digital software and assets in general. FinTech companies like PayPal offered new services to help retail investors access the crypto market.
3. To finance the Corona measures, many countries took on even more debt, causing central bank money supply to increase significantly. Fearing hyper inflation, investors are increasingly investing in assets with deflationary characteristics such as Bitcoin.
4. Several institutional investors followed this trend and put money into cryptocurrencies, including MassMutual, Micro Strategy, and Tesla.
Conclusion:
Overall, the performance of Bitcoin shows high volatility in the crypto market. Three major price bubbles and their bursting were observed between 2011 and 2020. If we look at the long-term graph with a logarithmic scale, the Bitcoin’s performance no longer seems so volatile, as the exponential growth is better illustrated.

The chart also shows the various price bubbles of the past. These bubbles
often occur in the short term, but have so far always recovered in the long term.
For a crypto investor it is crucial: Even if Bitcoin was bought at the peak of the last bubbles (here: $35/BTC, $1,150/BTC and $20,000/BTC), from today’s perspective every investor would have been clearly profitable.